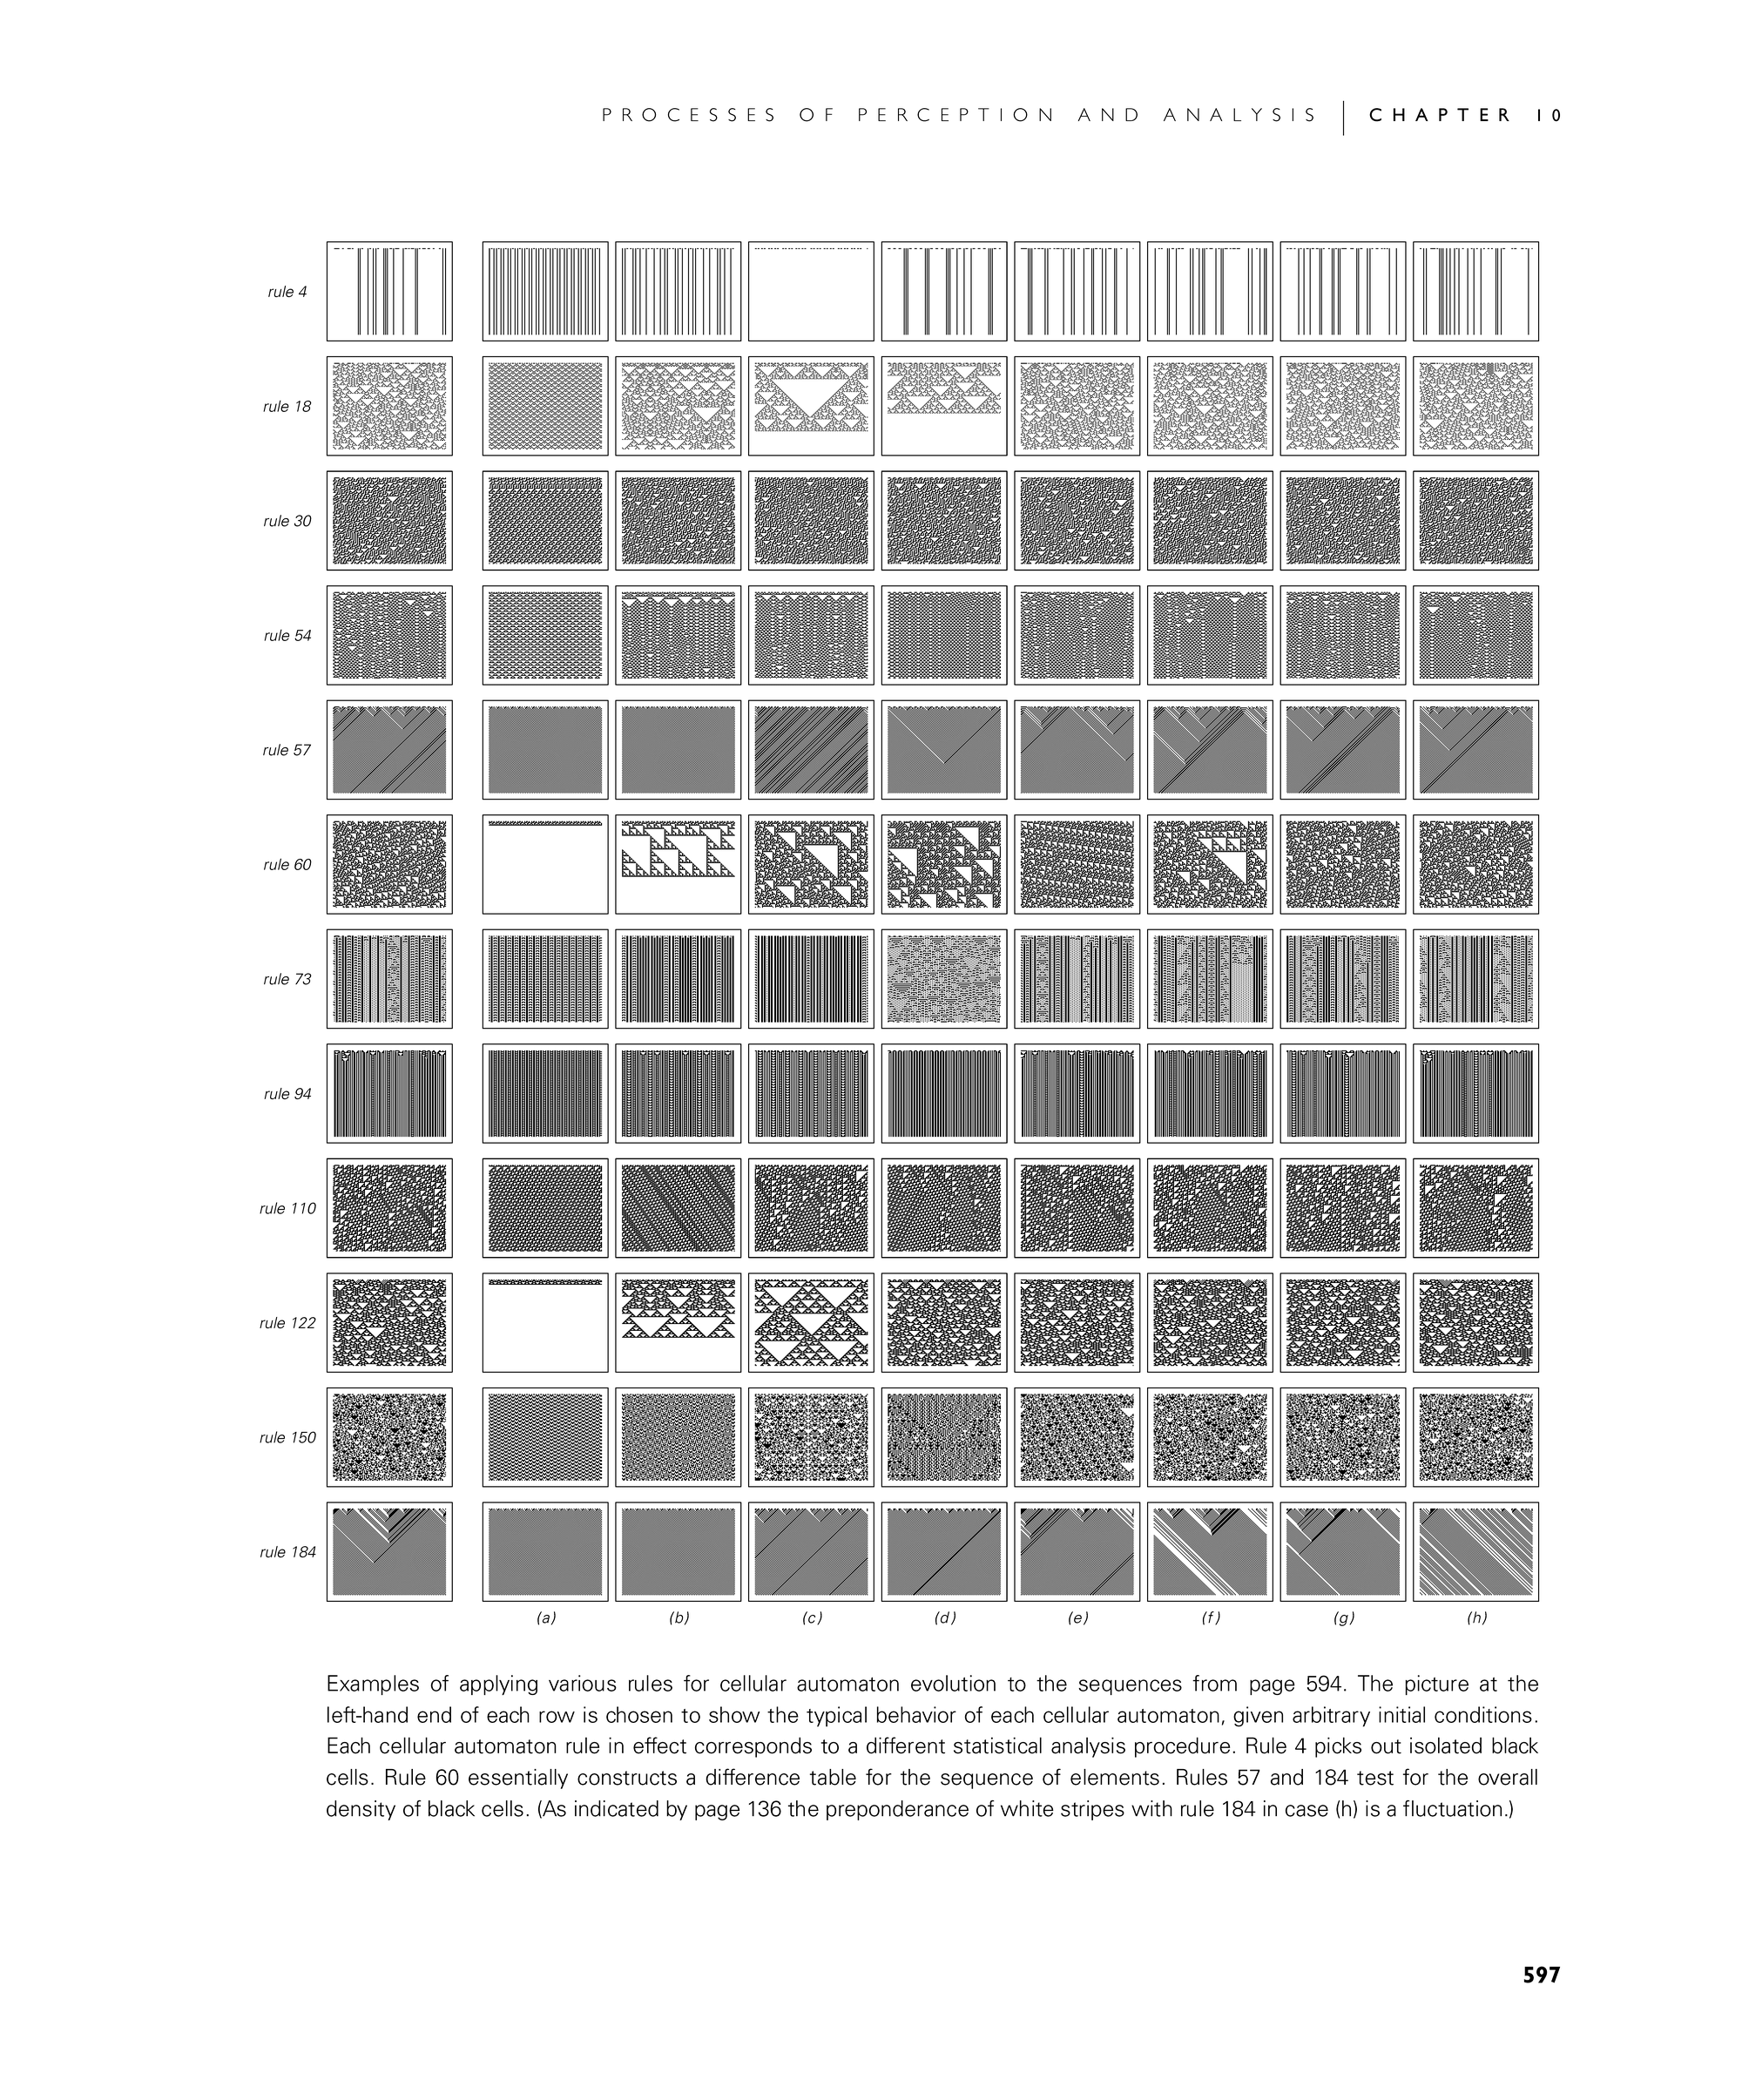
Examples of applying various rules for cellular automaton evolution to the sequences from page 594. The picture at the left-hand end of each row is chosen to show the typical behavior of each cellular automaton, given arbitrary initial conditions. Each cellular automaton rule in effect corresponds to a different statistical analysis procedure. Rule 4 picks out isolated black cells. Rule 60 essentially constructs a difference table for the sequence of elements. Rules 57 and 184 test for the overall density of black cells. (As indicated by page 136 the preponderance of white stripes with rule 184 in case (h) is a fluctuation.)


